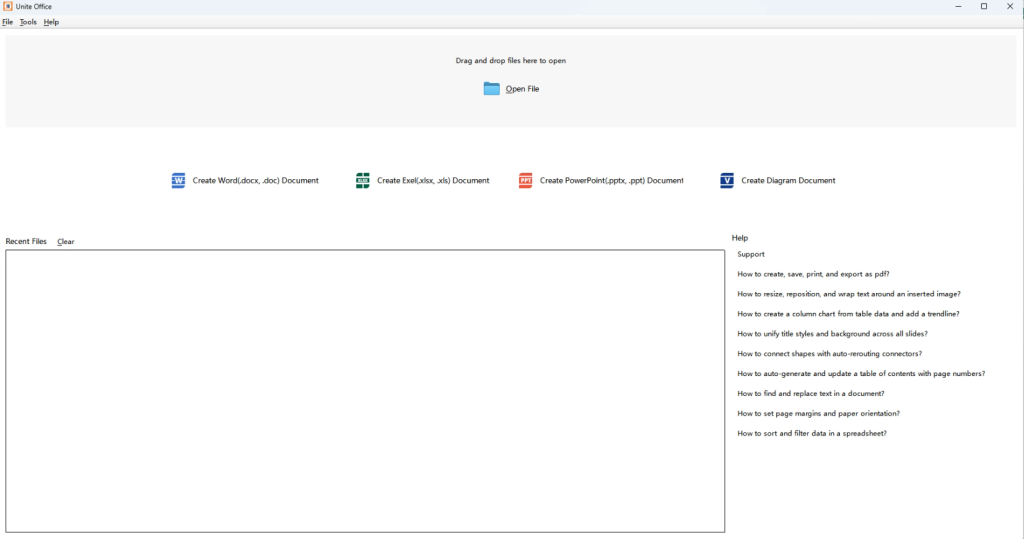
This help document applies to the four core applications of the Unite Office suite: DOCX Edit (word processing), XLSX Edit (spreadsheets), PPTX Edit (presentations), and Diagram Draw (vector graphics). It is organised into common basic operations and module‑specific features, each with subtopics for easy navigation.
I. Common Basic Operations (Shared by All Applications)
1. Launching and Interface Overview
- Launch: Double‑click the Unite Office icon to open the startup centre, then select the desired app; or double‑click a supported file (e.g.,
.docx,.xlsx,.pptx,.odg) to open it directly. - Interface: All apps include a title bar, menu bar (File, Edit, View, Insert, Format, Tools, etc.), toolbar, editing area, and status bar (showing page number, word count, zoom, etc.).
2. New, Open, and Save
- New:
File>New> choose type, or pressCtrl+N(creates a blank document of the current app). - Open:
File>Open(Ctrl+O) – supports many formats:- DOCX Edit:
.docx,.doc,.odt,.rtf,.txt - XLSX Edit:
.xlsx,.xls,.ods,.csv - PPTX Edit:
.pptx,.ppt,.odp - Diagram Draw:
.odg,.svg,.vsd,.dxf
- DOCX Edit:
- Save:
File>Save(Ctrl+S) – first time prompts “Save As”;File>Save Asallows format or name change. Default formats are widely compatible (e.g., DOCX Edit saves as.docx, XLSX Edit as.xlsx).
3. Printing
- Print Preview:
File>Print Previewto check pagination, margins, and layout. - Page Setup:
Format>Page(or “Page Style”) to adjust paper size (A4, Letter, etc.), orientation (Portrait/Landscape), margins, and headers/footers (common in DOCX Edit and XLSX Edit). - Print:
File>Print(Ctrl+P) – choose printer, copies, range (all, current, specific pages), then click Print.
4. Inserting Images
- From File: Place cursor where desired,
Insert>Image>From File, select an image (supports.png,.jpg,.gif,.svg, etc.). - Drag‑and‑Drop: Drag an image file directly from file explorer into the editing area.
- Adjusting: Select the image – drag corner handles to scale proportionally; right‑click for Arrange (bring to front/send to back); property panel allows wrap (DOCX Edit), crop, transparency, and colour corrections.
5. Undo and Redo
- Undo:
Ctrl+Zor toolbar button. - Redo:
Ctrl+Y(orCtrl+Shift+Z) or toolbar button.
6. Other Common Operations
- Cut/Copy/Paste:
Ctrl+X,Ctrl+C,Ctrl+V. - Find and Replace:
Ctrl+F(Find),Ctrl+H(Replace). - Insert Hyperlink: Select text or object, press
Ctrl+K– link to a web URL, email address, or internal bookmark.
II. DOCX Edit – Word Processing
1. Styles and Formatting
- Styles Panel: Quickly apply predefined styles like “Heading 1”, “Heading 2”, “Body Text”.
- Modify Styles: Right‑click a style > “Modify” – adjust font, size, colour, spacing; all text using that style updates automatically.
- Create New Style: Format a paragraph as desired, then in the styles list choose “New Style from Selection” and name it.
2. Table of Contents (TOC)
- Apply heading styles to chapter titles.
- Place cursor where TOC should appear (usually at the beginning).
Insert>Table of Contents and Index>Table of Contents– choose style and levels.- After content changes, right‑click the TOC and select “Update Index/Table” to refresh.
3. Mail Merge
- Prepare a data source (e.g., a contact list in XLSX Edit with fields like Name, Address).
- Write the letter in DOCX Edit and insert data fields (e.g., “«Name»”).
Tools>Mail Merge Wizard– follow steps to select data source, insert fields, preview, and merge to individual documents or print bulk letters/labels.
4. Footnotes and Endnotes
- Place cursor after the text to annotate,
Insert>FootnoteorEndnote. - Footnotes appear at the bottom of the page; endnotes at the end of the document. Numbering format can be customised.
5. Cross‑references
- Insert references to figures, headings, bookmarks, etc., for easy navigation.
Insert>Cross‑reference– choose reference type (e.g., “Heading”) and content (e.g., “Page number” or “Number”), then insert.- When the target changes, select all (
Ctrl+A) and pressF9to update all cross‑references.
III. XLSX Edit – Spreadsheets and Chart Statistics
1. Data Entry and Formulas
- Type text, numbers, or dates directly into cells.
- Formulas start with
=– e.g.,=SUM(A1:A10),=AVERAGE(B2:B20). - Use the Function Wizard (
fxbutton) to search and insert functions – supports IF, VLOOKUP, COUNTIF, and hundreds more.
2. Sorting and Filtering
- Sort: Select data range (including headers),
Data>Sort– choose column and order (ascending/descending), add multiple levels. - AutoFilter: Select range,
Data>AutoFilter– drop‑down arrows appear on headers; filter by text, numbers, or colours. - Advanced Filter:
Data>More Filters>Advanced Filter– supports complex criteria or extracting unique values.
3. Pivot Tables
- Select source data,
Data>Pivot Table. - In the wizard, drag fields to rows, columns, values, and filters to dynamically summarise, group, and cross‑tabulate large datasets.
- Double‑click a summary value to drill down and view underlying details.
4. Chart Statistics (Key Feature)
Creating a Chart:
- Select the data range (include row/column headers).
Insert>Chartto open the Chart Wizard.- Choose Chart Type:
- Column Chart: Compare values across categories.
- Line Chart: Show trends over time or sequence.
- Pie Chart: Display proportions.
- Bar Chart: Horizontal column chart – good for long labels.
- Scatter Plot: Analyse correlation between variables.
- Other types: Area, Radar, Stock, etc.
- Data Range: Confirm or adjust, choose whether series are in rows or columns.
- Chart Elements: Add titles, axis labels, legend, data labels, gridlines.
- Click Finish – the chart is embedded in the sheet.
Editing and Formatting:
- Double‑click the chart to enter edit mode – drag elements, resize.
- Right‑click on background, legend, axis, etc., and choose “Format” for detailed customisation (fonts, colours, borders, fills).
- The properties panel (right side) allows quick changes to type, data range, axis scaling, error bars, etc.
- When source data changes, the chart updates automatically; if not, right‑click and choose “Update”.
Advanced Statistics Features:
- Add Trendlines: Right‑click a data series > “Insert Trendline” – choose linear, exponential, polynomial, etc., for forecasting.
- Dual Axes: Enable a secondary axis for different series – useful when units differ.
- Data Point Formatting: Customise colours/markers for maximum, minimum, or specific values.
- Charts can be copied and pasted into DOCX Edit or PPTX Edit while remaining editable.
IV. PPTX Edit – Presentations
1. Slide Management
- The left thumbnail pane lets you add, delete, duplicate, and drag to reorder slides.
- Right‑click a slide to change its Layout (Title Slide, Title and Content, Two‑Content, Blank, etc.).
2. Master View (Unified Design)
View>Master>Slide Master.- Set background, fonts, colours, and placeholder positions in the master – all slides using that master inherit the changes.
- Adjust individual master layouts (e.g., Title Master) separately.
- Close master view when finished.
3. Animations
- Select an object (text box, image, shape),
Slide Show>Custom Animation. - Click “Add Effect” – choose Entrance (Fade, Fly In), Emphasis (Pulse, Spin), Exit (Fade Out, Fly Out), or Motion Path.
- Arrange the animation order and set each with:
- Start: On Click, With Previous, After Previous.
- Duration and Delay.
- Click “Play” to preview.
4. Slide Transitions
- In the sidebar “Transitions” panel, select an effect (Fade, Push, Wipe, Blinds, etc.) between slides.
- Set speed, optional sound, and advance method (mouse click or automatic timing).
- Click “Apply to All Slides” to use the same transition throughout.
5. Presenter View
- With dual screens (e.g., projector) connected, enable
Slide Show>Presenter View. - The presenter’s screen shows the current slide, next preview, speaker notes, and timer; the audience only sees the current slide.
- During the show, use pointer tools (pen, highlighter) to annotate.
6. Export and Sharing
File>Export As>Export as PDF– include handouts or notes as needed.File>Export As>Export as Video– save as MP4 or AVI.- Also export as images (one per slide) or older PowerPoint format (
.ppt).
V. Diagram Draw – Vector Graphics
1. Drawing Tools
- Toolbar provides rectangle, ellipse, line, polygon, Bézier curve, connector, freeform line, etc.
- Hold
Shiftwhile drawing to constrain proportions (square, circle, 45° lines); holdCtrlto draw from the centre. - Use the “Text” tool to add a text box anywhere, or double‑click a shape to type inside it.
2. Object Editing (Edit Points Mode)
- Double‑click any curve or polygon to enter “Edit Points” mode.
- Drag existing nodes to reshape; right‑click on the path to add or delete nodes.
- Right‑click a node and choose “Convert to Curve” or “Convert to Line” for smooth or sharp transitions.
- Exit edit mode to scale, rotate, or move the whole object.
3. Layer Management
View>Layerto open the layers sidebar.- Default layers include “Layout”, “Background”, etc. Click “+” to create a new layer and name it.
- Each layer can be independently shown/hidden, locked (prevent editing), and set for printing.
- Select an object, right‑click >
Arrange>Assign to Layerto move it to a chosen layer.
4. Connectors and Flowcharts
- Select the Connector tool, click a connection point (small blue cross) on the first shape, drag to a connection point on the second shape – the connector stays attached even when shapes move.
- To add custom connection points,
Insert>Glue Point, then click on a shape to place a new point. - The “Gallery” sidebar provides ready‑made flowchart symbols (Start/End, Decision, Process, etc.) – drag and drop them onto the page.
5. Align and Distribute
- Select multiple objects,
Shape>Align– choose Left, Right, Top, Bottom, Horizontal Center, or Vertical Center. Shape>Distribute– evenly space objects horizontally or vertically.- Enable
View>Snap to Grid,Snap to Guides, orSnap to Object Bordersfor precise positioning.
6. Export and Output
File>Export As>Export as PDF– vector format suitable for printing.File>Export As>Export as Images– choose PNG, JPEG, BMP, GIF, etc.- Also supports SVG, EPS, DXF for exchange with other design software.
- You can set export range (all pages or current page) and image resolution.